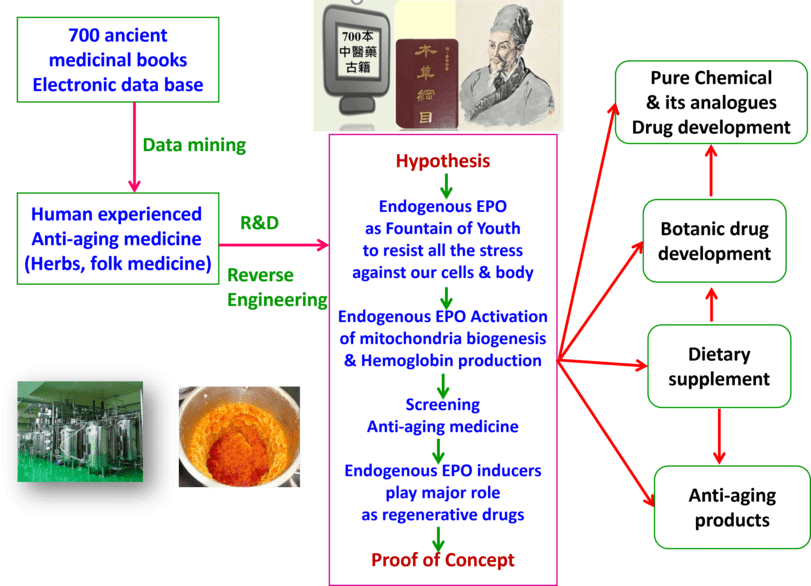
Activating mitochondrial regulator PGC-1a expression by astrocytic NGF is a therapeutic strategy for Huntington’s disease.
Li-Wen Chen, Lin-Yea Horng, Chia-Ling Wu, Hui-Ching Sung, Rong-Tsun Wu, Neuropharmacology 63:719-732, 2012.
Mitochondrial dysfunction plays an important role in Huntington’s disease (HD). NGF gene delivery in AD patients showed an increase in brain energy metabolism and NGF has been shown neuroprotective effects against mitochondrial toxins. However, the role of NGF in regulating mitochondrial function is unclear. Here, we found that NGF-stimulated mitochondrial biogenesis in PC12 and primary neuron cells.
Our results demonstrated that peroxisome proliferator-activated receptor gamma coactivator 1-α (PGC-1α) is a downstream key target of the NGF signalling pathway. In a 3-nitropropionic acid (3-NP) cell model, NGF treatment rescued the defects in mitochondrial activity and mitochondrial membrane potential. Since NGF cannot freely cross bloodebrain barrier, we found an astrocytic NGF inducer, Ganoderma lucidum (GaLu) extract. Its active constituents had potent effects on the induction of NGF in primary astrocytes. Among the identified ingredients, ganoderic acid C2 was most effective.
We further found that GaLu-conditioned media can enhance mitochondrial biogenesis in PC12 cells and preventing NGF signalling using NGF antibody or PGC-1α siRNA blocked these effects. Moreover, GaLu and ganoderic acid C2-conditioned media treatment attenuated mitochondrial defects in 3-NP cell model. After 3-Npinduced behavioural impairment and striatal degeneration in mice, GaLu treatment therapeutically restored the behaviour score, sensorimotor ability and neuronal loss. We found that striatal NGF, PGC-1 α expression level and succinate dehydrogenase activity were recovered in GaLu-fed mice.
These results suggest that the NGF-signalling pathway connected to the mitochondrial regulator, PGC-1α expression.
This signalling triggered by astrocytic NGF with small molecule inducers may offer a therapeutic strategy for HD.
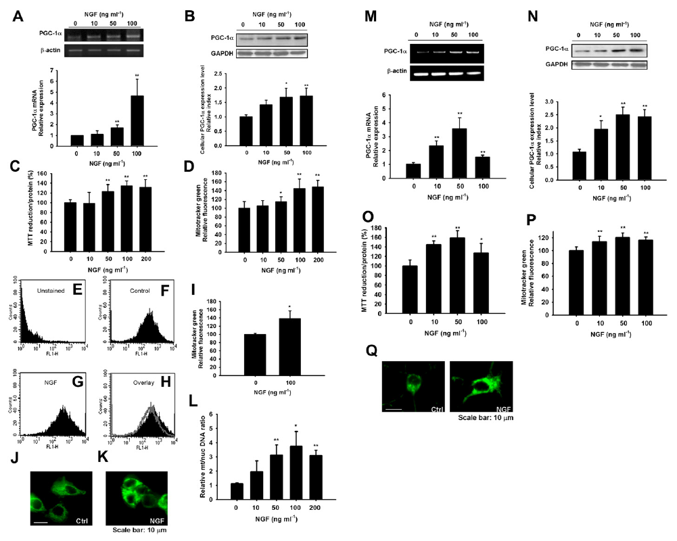
Fig. 1. Effects of NGF on PGC-1α expression and mitochondrial biogenesis in PC12 cells and primary striatal neurons. (A) Both RT-PCR and real time PCR showed that NGF treatmentfor 6 h triggered PGC-1α mRNA expression in PC12 cells. The expression of β-actin was used as an internal control. (B) Western blotting showed that NGF treatment for 24 htriggered PGC-1α protein expression in PC12 cells. The expression of GAPDH was used as an internal control. Results are expressed as the relative index of untreated controls± SD ofat least three independent measurements. (*P < 0.05, **P < 0.01, one-way ANOVA followed by Tukey’s multiple comparison test). Increases in cellular mitochondrial activity andcontent after 48 h NGF exposure were detected using the succinate dehydrogenase assay, Mitotracker staining microplate assay, Mitotracker staining flow cytometry assay andmitochondrial to nuclear DNA ratios. (C) Succinate dehydrogenase activity was determined using the MTT reduction assay (n=8) and is expressed relative to the respective control conditions (without NGF). (D) A Mitotracker-staining microplate assay (n=8) is shown. (E) A Mitotracker staining flow cytometry assay (n=3) is shown. Representative histograms for unstained (E), control (F), or 100 ng/ml NGF (G) for 48 h are shown. (H) a control histogram (from F, grey) is overlaid with a NGF histogram (from G, black) to show an increase in fluorescence intensity. (I) represents the mean fluorescence of Mitotracker staining detected by flow cytometry, expressed relative to control condition. Representative pictures from mitotracker-green stained cells treated without NGF (J) and with NGF 100 ng/ml (K) were shown. (L) Mitochondrial-to-nuclear DNA ratios are determined by quantitative real-time PCR (n=5) and are expressed relative to control conditions. *P < 0.05, **P < 0.01 compared to the control, Student’s t-test. (M) RT-PCR and Real time PCR showed that NGF treatment for 6 h triggered PGC-1α mRNA expression in primary striatal neurons. The expression of β-actin was used as an internal control. (N) Western blotting showed that NGF treatment for 24 h triggered PGC-1α protein expression in primary striatal neurons. The expression of GAPDH was used as an internal control. Results are expressed as the relative index of untreated controls ± SD of at least three independent measurements (*P < 0.05, **P < 0.01, one-way ANOVA followed by Tukey’s multiple comparison test). Increases in cellular mitochondrial activity and content after 48 h NGF exposure were detected using the succinate dehydrogenase assay (n=8) (O), Mitotracker staining microplate assay (n= 8) (P). *P < 0.05, **P < 0.001 compared to the control, Student’s t-test. (Q) Representative pictures from mitotracker-green stained cells treated without NGF and with NGF 50 ng/ml were shown.
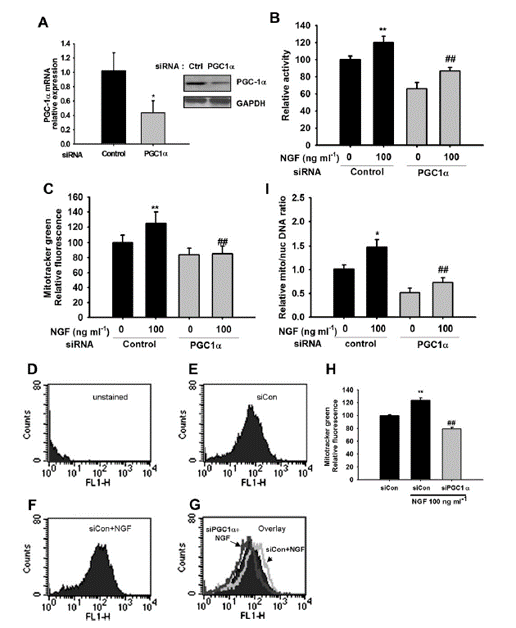
Fig. 2. PGC-1α is required for the induction of mitochondrial biogenesis by NGF. PC12 cells transfected with PGC-1α-specific siRNA resulted in a reduction in PGC-1α mRNA and protein expression, as detected by real time PCR (n= 5; left panel) and western blotting (n= 3; right panel) (A). At 24 h post-transfection, cells were incubated with media containing NGF 100 ng/ml or control media for 48 h. Transfection of PGC-1α specific siRNA results in loss of NGF-induced increases in succinate dehydrogenase activity (n =8) (B) and Mitotracker staining, as assessed by microplate assays (n=8) (C) and flow cytometry assays (n=3) (D), and mitochondrial DNA was assessed by real time PCR (n= 5) (I). Representative histograms for unstained (D), control siRNA (E), or cells transfected with control siRNA and treated with 100 ng/ml NGF (F). (G) A control histogram (from E, black) is overlaid with a histogram from F (light grey) to show the increase in fluorescence intensity and also overlaid with a histogram from cells transfected with PGC-1α specific siRNA and treated with NGF (dark grey) to show the decrease in fluorescence intensity. (H) represents the mean fluorescence of Mitotracker staining detected by flow cytometry, expressed relative to the control conditions. (I) Mitochondrial DNA to genomic DNA ratio was assessed by real time PCR (n=5). *P < 0.05, **P < 0.01 compared to the control, ## P < 0.01 compared to the control cells treated with NGF, Student’s t-test.
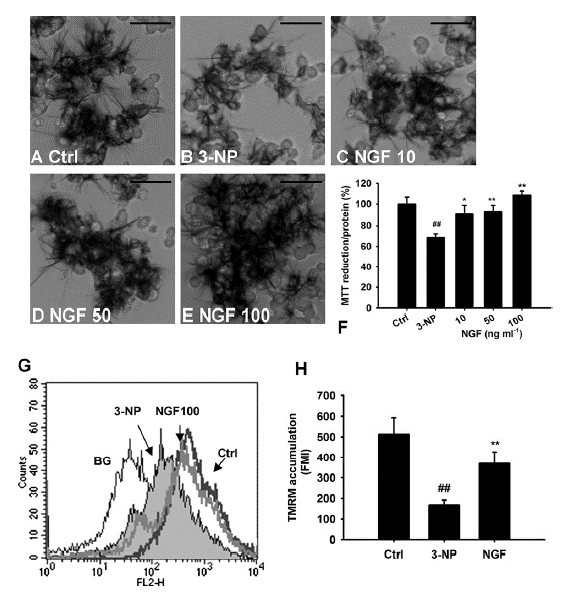
Fig. 3. Effects of NGF on 3-NP-induced mitochondrial dysfunction in PC12 cells. PC12 cells exposed to 10 mM 3-NP for 6 h resulted in mitochondrial dysfunction analyzed by (A) Succinate Dehydrogenase activity and (G and H) mitochondrial membrane potential. Note the succinate dehydrogenase activity (B) and mitochondrial membrane potential (H) were decreased in cells exposed to 3-NP compared with control cells. ##P < 0.01 compared to control, Student’s t-test. After 3-NP damage, cells were treated with/without NGF for 24 h, Succinate Dehydrogenase activity was measured using MTT assay. Representative pictures from MTT stained cells were shown as (A) Ctrl, (B) 3-NP, (C) NGF 10 ng ml1, (D) NGF 50 ng/ml and (E) NGF 100 ng/ml. (F) The MTT assay assessed by microplate reader (n=8). (G) Fluorescence of TMRM in cells after NGF treatment for 24 h was shown. The accumulation of TMRM, demonstrating that accumulation of the dye is highly sensitive to the loss of mitochondrial membrane potential. Detection of TMRM levels in individual cells after treatment was performed by FACS. Note the left shift of the fluorescence distribution in cells exposed to 3-NP, indicating a reduced membrane potential. When cells were treated with NGF (100 ng/ml, the fluorescence distribution was shifted back to the same intensity as control cells. (H) Histograms representing the quantification of fluorescence mean intensity (FMI) measured in two independent experiments from flow cytometry (n=3). Data are mean ± SD (##P < 0.01 compared with control; *P < 0.05, **P < 0.01 compared with 3-NP, Student’s t-test.).
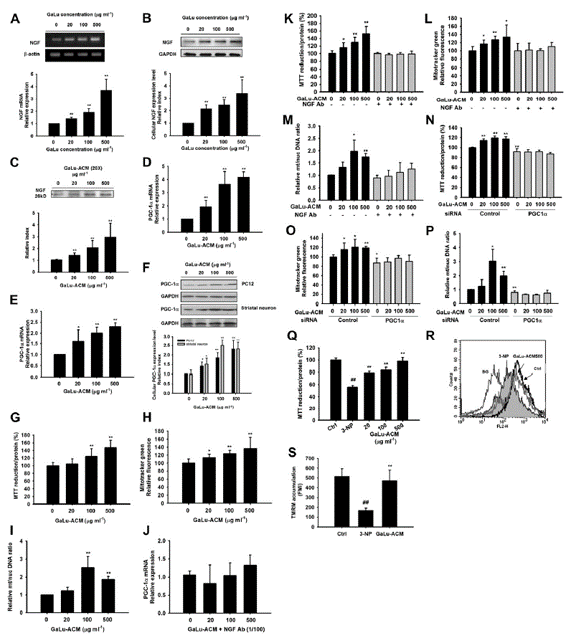
Fig. 4. GaLu, an astrocytic NGF inducer, regulated mitochondrial biogenesis and attenuated 3-NP-induced mitochondrial impairments in PC12 cells. Primary astrocytes were treated with GaLu for 6 h for mRNA analysis (A) or for 24 h for protein analysis (B). (C)Western blot showing NGF in 20-fold concentrated conditioned media collected from astrocyte cultures treated with GaLu (GaLu-ACM) for 24 h. (D) PC12 cells were treated with GaLu-ACM for 24 h. PGC-1α mRNA expressionwas analyzed using real time PCR. (E) PGC-1a mRNA expression was increased in a dose-dependent manner in primary striatal neurons treated with GaLu-ACM for 24 h. (F)Western blotting analyzed PGC-1a protein expression in PC12 and striatal neurons treated with GaLu-ACM for 24 h. Results are expressed as the relative index of untreated controls ± SD of at least three independent measurements (*P < 0.05, **P < 0.01, one way ANOVA followed by Tukey’s multiple comparison test). (G) Increases in cellular mitochondrial SDH activity and content after GaLu-ACM exposure were detected using MTT assay (n= 8), the Mitotracker staining microplate assay (n = 8) (H), and mitochondrial to nuclear DNA ratios, as determined by quantitative real time PCR (n= 5) (I). *P < 0.05, **P < 0.01 compared to the untreated control, Student’s t-test. (J) Incubation of GaLu-ACM with NGF-specific antibody for 24 h resulted in a reduction of PGC-1a mRNA expression, as detected by real time PCR (n=3). (K) Incubation of GaLu-ACM with a NGFantibody resulted in the loss of GaLu-ACM-induced increases in succinate dehydrogenase activity (n=8), the Mitotracker microplate assay (n=8) (L) and mitochondrial DNA content, as assessed by quantitative real-time PCR (n=3) (M). Transfection of PGC-1α-specific siRNA results in a reduction of GaLu-ACM -induced increases in succinate dehydrogenase activity (n=8) (N) and Mitotracker staining, as assessed by the microplate assay (n=8) (O), as well as mitochondrial DNA content, which was assessed by real time PCR (n=5) (P). Results are expressed as the relative index of ACM control SD. *P < 0.05, **P < 0.01 compared to untreated control, Student’s t-test. (Q) Succinate Dehydrogenase activity was measured in 3-NP-exposed PC12 cells treated with GaLu-ACM for 24 h (n= 8). (R) Fluorescence of TMRM in 3-NP-exposed PC12 cells after GaLu-ACM (500 mg/ml treatment for 24 h. (S) Histograms representing the quantification of fluorescence mean intensity measured in two independent experiments from flow cytometry (n=3). Data are mean± SD (##P < 0.01 compared with control; **P < 0.01 compared with 3-NP, Student’s t-test.).
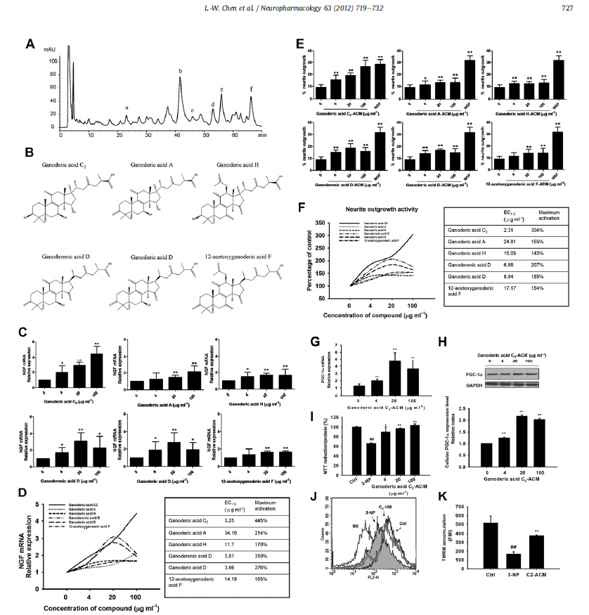
Fig. 5. Identification of constituents from GaLu and the effect of ganoderic acid C2 in PC12 cells and a 3-NP cell model. (A) HPLC analysis of GaLu ethanol extracts. Reverse-phase HPLC profile, column: Nucleosil C18 (4.6 mm 250 mm; 5 mm). The mobile phase consisted of 0.1% aqueous acetic acid and acetonitrile using a linear gradient program of 30-32% acetonitrile in 40 min, 32-40% acetonitrile in 40-60 min, 40% acetonitrile in 60-65 min, 40-82% acetonitrile in 65-70 min; flow rate: 0.8 ml/min; detection wavelength: 254 nm. A total of 6 triterpenoids were speculated. (B) Chemical structures of the 6 triterpenoids identified from the GaLu extracts (aef). (C) Real time PCR analysis of NGF mRNA expression in astrocytes treated with each constituent for 6 h. The expression of β-actin was used as the internal control. (D) Potency was tracked by determining the concentration of the compound required to increase activity by 50% (EC1.5), and the maximum activation potential was listed. (E) PC12 cells were treated with GaLu-ACM or NGF (positive control) for 24 h, and the neurite outgrowth activity was revealed by the percent of neurite outgrowth. (F) Potency was tracked by determining the concentration of the compound required to increase the activity by 50% (EC1.5), and the maximum activation potential is listed. Results are expressed as the relative index of control ± SD of at least three independent measurements (*P < 0.05, **P < 0.01, one-way ANOVA followed by Tukey’s multiple comparison test). PGC-1a mRNA and protein expression were increased in PC12 cells by ganoderic acid C2-ACM treatment analyzed with real time PCR (n= 4) (G) and western blotting (n= 3) (H). Ganoderic acid C2-ACM treatment attenuated 3-NP-induced mitochondrial dysfunction. (I) Succinate Dehydrogenase activity was measured in 3-NP-exposed PC12 cells treated with ganoderic acid C2-ACM for 24 h (n= 8). (J) Fluorescence of TMRM in 3-NP-exposed PC12 cells after ganoderic acid C2-ACM (100 mg ml1) treatment for 24 h. (K) Histograms representing the quantification of FMI measured in two independent experiments from flow cytometry (n=3). Data are mean ± SD (##P < 0.01 compared with control; *P < 0.05, **P < 0.01 compared with 3-NP, Student’s t-test.).
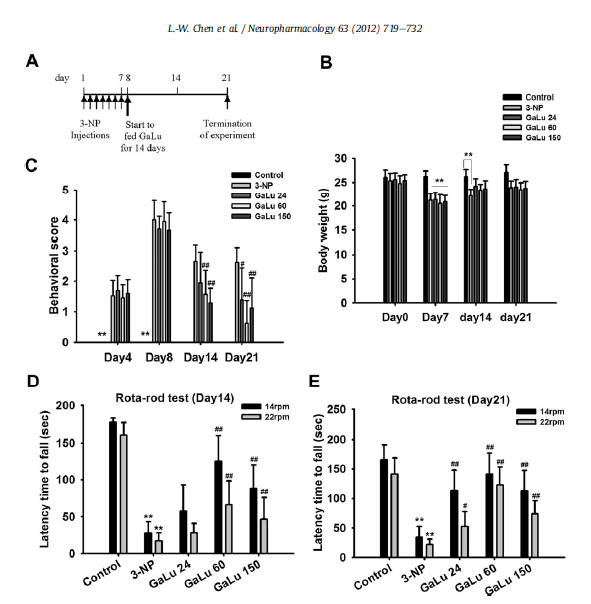
Fig. 6. GaLu extract treatment improved body weight change and behavioural performance in the 3-NP model. (A) The schedule for 3-NP-induced mitochondrial dysfunction animal model. After 3-NP intoxication, animals were fed GaLu 24, 60 and 150 mg/kg on days 8-21 (total of 14 days). (B) The body weight change throughout the experiment was recorded. Data are mean±SD (**P < 0.01, the 3-NP-injected groups compared to the PBS control). Note that on day 14, only 3-NP group had less body weight than the PBS control. (C) Behavioural scores changes throughout the experiment were recorded. Data are mean ± SD (**P < 0.01, PBS control compared to the 3-NP-injected 4 groups; #P < 0.05, ##P < 0.01, GaLu-fed group compared to 3-NP). One-way ANOVA followed by Tukey’s multiple comparison test (n =8-12 for each experimental group). (D, E) Animals treated with 24, 60 and 150 mg/kg GaLu for 7 or 14 days after 3-NP intoxication were subjected to the rotarod behavioural task as a measurement of sensorimotor ability. Rotarod scores were determined as the sum of the latencies to falling over three trials, using both 14 and 22 rpm for each trial. The GaLu-fed group showed significant improvement compared to the 3-NP mice in either the 14 or 22 rpm task. The GaLu 60 mice were markedly better than the other groups. Data are mean ± SD (*P < 0.05, **P < 0.01 compared to PBS control and #P < 0.05, ##P < 0.01 compared to 3-NP). One-way ANOVA followed by Tukey’s multiple comparison test (n= 8-12 for each experimental group).
NGF treatment attenuated mHtt-74Q-induced transcriptional dysregulation of PGC-1a and mitochondrial dysfunction in a HD cell model.
Doxycycline-inducible EGFP-mHtt74Q PC12 stable cell line
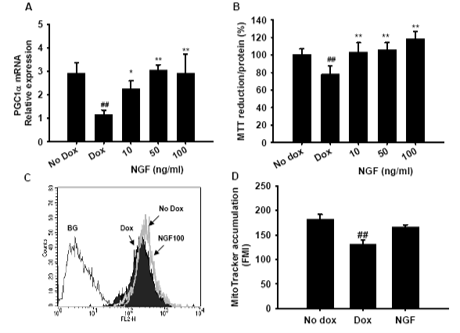
Mitochondrial membrane potential
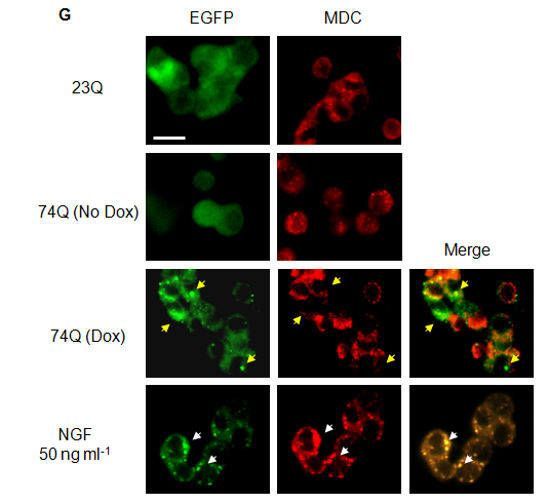
Fig. 2G Effect of NGF in mHtt74Q-expressing PC12 cell model.
NGF enhanced the autophagosome formation, which may facilitate the degradation of mHtt. Autophagic vacuoles in cells were stained using MDC. Note the enhanced MDC stain was shown in NGF-treated cells. A white arrow indicates the co-localization of MDC and EGFP in NGF-treated cells, while the yellow arrows indicate the EGFP aggregates and MDC-stained puncta in the Dox-treated cells. Note that there was rare co-localisation of EGFP and MDC in Dox cells. (Scale bar: 10 mm).
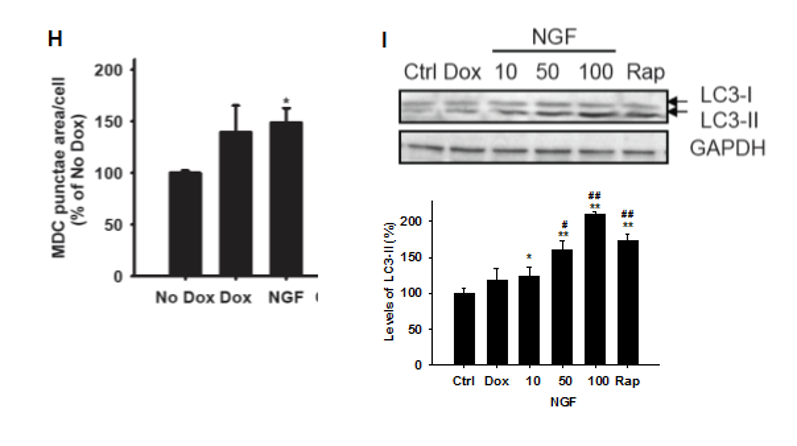
Fig.2H Effect of NGF in mHtt74Q-expressing PC12 cell model.
Quantification of the MDC stain. Results were expressed as puncta area per cell relative to the untreated control (no dox). (I) Western blot of LC3-I and LC3-II protein levels in each condition is shown (Rapamycin 200 nM as a positive control for induction of autophagy) (n=3). *P < 0.05, **P < 0.01 compared to No Dox, #P < 0.05, ##P < 0.01 compared to Dox, Student’s t-test.
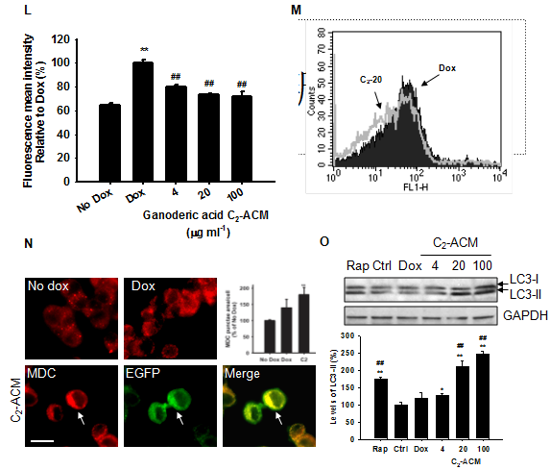
Figure 5. Effect of ganoderic acid C2 in an HD model.
(L) Inhibition of mHtt-74Q aggregates by ganoderic acid C2-ACM measured by flow cytometry. FMI ratio of cells treated with ganoderic acid C2-ACM. Histograms representing the quantification of FMI measured in two independent experiments (n=6). (M) Note the shift to the left of the fluorescence distribution in cells expressing mHtt-74Q and treated with ganoderic acid C2-ACM 20 mg ml-1, indicating a reduction in aggregates. (N) Ganoderic acid C2-ACM enhanced MDC intensity. The white arrow indicates the co-localization of MDC and EGFP in ganoderic acid C2-ACM-treated cells (Scale bar: 10 mm). Quantification of MDC staining is shown for puncta area per cell relative to untreated control (no dox). (O) Western blot of LC3-I and LC3-II protein levels in each condition is shown (Rapamycin 200 nM was used as positive control for induction of autophagy) (n=3).